%20%20--%3E%0A%3Csvg%20version%3D%221.1%22%20id%3D%22Layer_1%22%20xmlns%3D%22http%3A%2F%2Fwww.w3.org%2F2000%2Fsvg%22%20xmlns%3Axlink%3D%22http%3A%2F%2Fwww.w3.org%2F1999%2Fxlink%22%20x%3D%220px%22%20y%3D%220px%22%0A%09%20viewBox%3D%220%200%20684.6%2068.1%22%20style%3D%22enable-background%3Anew%200%200%20684.6%2068.1%3B%22%20xml%3Aspace%3D%22preserve%22%3E%0A%3Cg%3E%0A%09%3Cpath%20d%3D%22M444.1%2C29.3h-17.4v14.5h17.4V29.3z%20M36.4%2C68.1l29.3-50.8V0H50.4L32.9%2C36.8L15.5%2C0H0v68.1h16.7V45.8l12.4%2C22.3H36.4z%0A%09%09%20M49.1%2C68.1h16.6V23.4L49.1%2C52.1V68.1z%20M76.6%2C68.1h45V53.8H93.3V41.6h21V27.1h-21V14.8h28.3V0.1h-45V68.1z%20M175.6%2C68.1h17.3v-68%0A%09%09h-16.5v40.3L150%2C0.1h-17.6v68h16.7V27.7L175.6%2C68.1z%20M235.8%2C14.8h15.4V0.1h-47.4v14.7H219v53.2h16.8V14.8z%20M290.3%2C45.9h-17.1%0A%09%09l7.5-15.6h2L290.3%2C45.9z%20M298.7%2C68.1h18l-32.2-68h-5.7l-32%2C68h18l3.3-7.1h27.1L298.7%2C68.1z%20M325.2%2C68.1h46.2V53.8h-29.6V0.1h-16.7%0A%09%09V68.1z%20M423.7%2C14.8h27.2V0.1H407v68h16.7V14.8z%20M462%2C68.1h46.2V53.8h-29.6V0.1H462V68.1z%20M564.8%2C34.1c0%2C10.7-7.2%2C19.2-18.5%2C19.2%0A%09%09c-11.4%2C0-18.5-8.5-18.5-19.2s7.1-19.2%2C18.5-19.2C557.6%2C14.9%2C564.8%2C23.4%2C564.8%2C34.1%20M580.6%2C34.1c0-19-14.2-34-34.3-34%0A%09%09c-20.2%2C0-34.3%2C15-34.3%2C34c0%2C19%2C14.1%2C34%2C34.3%2C34C566.4%2C68.1%2C580.6%2C53.1%2C580.6%2C34.1%20M604.8%2C20.5c0-4.1%2C3.3-6.2%2C6.7-6.2%0A%09%09c4.4%2C0%2C6.6%2C3%2C6.6%2C6.6h14.7C631.8%2C9.1%2C625.1%2C0.1%2C611%2C0.1c-12%2C0-21.7%2C9.3-21.7%2C20.6c0%2C10.9%2C5.9%2C15.9%2C16.7%2C19.8%0A%09%09c5.2%2C1.8%2C11.5%2C3.2%2C11.5%2C8c0%2C3.3-2.4%2C5.5-6.4%2C5.5c-3.6%2C0-6.6-3-6.6-6.7h-15.2c0%2C11.5%2C7.9%2C20.8%2C21.8%2C20.8c12%2C0%2C21.6-9.3%2C21.6-20.6%0A%09%09c0-10-5.3-16.4-16.7-19.8C610.6%2C26.1%2C604.8%2C25.3%2C604.8%2C20.5%20M670%2C20.9h14.7C683.8%2C9.1%2C677.1%2C0.1%2C663%2C0.1c-12%2C0-21.7%2C9.3-21.7%2C20.6%0A%09%09c0%2C10.9%2C5.9%2C15.9%2C16.7%2C19.8c5.2%2C1.8%2C11.5%2C3.2%2C11.5%2C8c0%2C3.3-2.4%2C5.5-6.4%2C5.5c-3.6%2C0-6.6-3-6.6-6.7h-15.2c0%2C11.5%2C7.9%2C20.8%2C21.8%2C20.8%0A%09%09c12%2C0%2C21.6-9.3%2C21.6-20.6c0-10-5.3-16.4-16.7-19.8c-5.4-1.6-11.3-2.4-11.3-7.2c0-4.1%2C3.3-6.2%2C6.7-6.2C667.7%2C14.4%2C670%2C17.3%2C670%2C20.9%0A%09%09%22%2F%3E%0A%3C%2Fg%3E%0A%3C%2Fsvg%3E%0A)
The United States is, famously, a linguistic melting pot, with estimates ranging from 350 to as many as 430 different languages being used across the country.
Out of all those, English understandably comes out on top nationwide. Almost four-fifths of Americans reported in the last census that they only speak English at home, making English America’s de facto official language (though, oddly, no de jure official language has ever been legally or formally recognized in the United States). After that, Spanish is America’s second most widely-spoken language, used in 62 percent of non-English speaking households, and giving America the world’s second-largest Spanish-speaking population, after Mexico.
But what would happen if we were to take English and Spanish off the table, and look instead at how the other 400 or so languages of the United States are used? A fascinating new analysis has done precisely that.
Language blog WordFinderX took household population data from the last census to discover the most spoken languages—outside of English and Spanish—across the United States. Breaking down the Census Bureau data by regions, states, major cities, and even individual districts and neighborhoods showed just how linguistically diverse American households truly are, and revealed some surprising geographic and linguistic trends in the process.
- Languages by State
- Languages by Region and City
- Close-Up on New York City
- Analysis of Individual Languages
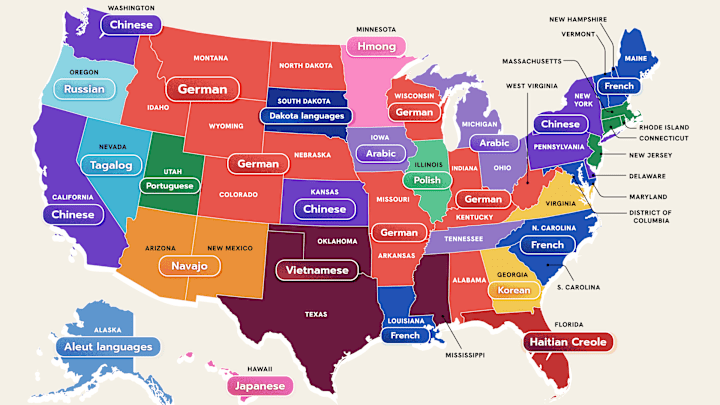
Languages by State

When looking at the data state by state, it was German that was found to come in third place across the United States: It’s ranked as the most spoken language after English and Spanish in no less than 13 different states—far outnumbering the likes of French (in seven), Chinese (in six), Arabic (in four), and Vietnamese (in three). Most of the German-speaking states are clustered in America’s so-called “German Belt,” where German immigration was once high. But the WordFinderX data nevertheless showed a handful of German-speaking outliers, including Alabama.
The state-by-state breakdown also showed that some major languages aren’t as widely used as we might think: Polish, Tagalog, and Japanese came out on top in just one state each (Illinois, Nevada, and Hawaii, respectively).
Languages by Region and City
 by major cities in the Western U.S.")
Some broader trends emerged when the states were grouped into regions, and when the household data was further broken down into cities and larger population hubs. Given that some 45 percent of Asian Americans live in America’s West, it’s perhaps understandable that Tagalog, one of the languages of the Philippines, came out on top in nine of the western U.S.’s major cities, closely followed by Chinese and Vietnamese (four cities each).
 by major city in the Southwestern U.S.")
Vietnamese also ranked highly in the southwest region, coming out on top after English and Spanish in five of the biggest cities there too (including three in Texas alone).
 by major city in the Midwestern U.S.")
Asian languages also fared well in the Midwest: Although French took the no. 1 spot in the most cities there, Hmong, Burmese, and Nepali topped the tables in Milwaukee, Fort Wayne, and Omaha, respectively.
 by major city in the southeastern U.S.")
In the southeastern states, Arabic proved the most spoken language in six major cities, including Nashville, Memphis, and Little Rock.
 by major city in the northeastern U.S.")
In far northeast corner of the United States, meanwhile, Greek came out on top after English and Spanish in Wilmington, Delaware, with Portuguese claiming that spot in Newark. But it was French, Chinese, and Haitian Creole that topped the tables in more cities than any other languages in the region, including Baltimore, New York, and Boston, respectively.
Close-Up on New York City
 by major city in New York City.")
Zooming in on New York and its neighborhoods in particular, however, showed just how much the varied history and centuries of immigration in the Big Apple have continued to influence the city and its patchwork of local languages. Alongside strong showings for Chinese, Russian, and French, New York also recorded Albanian and Igbo, the language of Nigeria’s Igbo people.
Analysis of Individual Languages

Flipping the data around to look at individual languages rather than locations, meanwhile, showed where each language in the analysis had its highest proportion of household speakers. More than 3 percent of all Maine households, for instance, reported speaking French at home, while just shy of 4 percent of Hawaiian households speak Japanese, and nearly 3 percent of households in Massachusetts speak Portuguese. California proved the domestic hotspot for no less than five different languages, including Cantonese and Mandarin.
As globally wide-ranging as America’s languages are, however, this analysis also showed some more concerning trends when it came to the Native American languages. While two states (Arizona and New Mexico) recorded Navajo as their most-spoken language after English and Spanish, and the Dakota Languages were South Dakota’s most used languages, nationwide, native languages were surprisingly underrepresented. In fact, only one Native American language (Navajo) came in behind English and Spanish just one city (Albuquerque), suggesting many of America’s earliest languages survive among far fewer households than we might expect. Some of the country’s 400 or so languages may ultimately need a little support to ensure their use continues long enough to be counted in the next census and beyond.
Discover More Fun Maps: