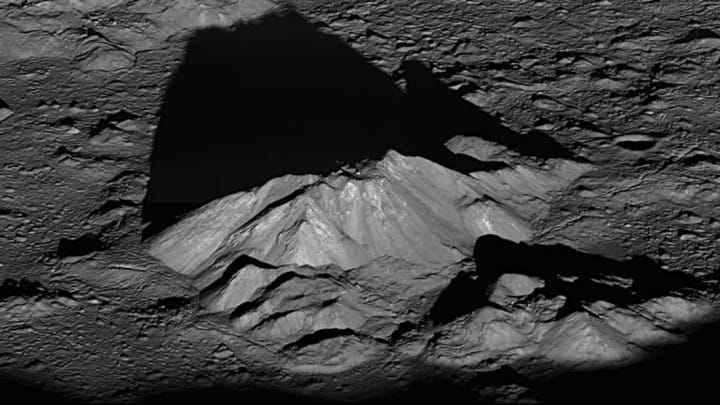
At the 46th annual Lunar and Planetary Science Conference in Houston last week, I met some of the planetary scientists who use the Lunar Reconnaissance Orbiter to craft maps of the moon—those spectacular, highly detailed images that appear in textbooks and online, and which are so ubiquitous that it rarely occurs to us to ask, “How was this done?” Planetary geologic mapping, as I learned, is not merely the result of clever computer algorithms painting photographs onto wireframe spheres (though computers have their place). Rather, human hands painstakingly refine such maps. Here is what a few scientists told me about mapping the moon and other celestial bodies.
The maps are huge.
The detail captured by the Lunar Reconnaissance Orbiter is extraordinary, capable even of focusing on the lunar footpaths left by the Apollo astronauts. When China put a rover on the moon in 2013, planetary scientists used the LRO to track the rover’s progress to counter the skepticism some had of information released by the Chinese government. Sure enough, the lander Chang’e 3 landed, and the rover Yutu roved.
Such level of detail comes at a price. The map files can be enormous. One-hundred-meter-per-pixel “global maps” clock in around 20 gigabytes for a single file. One map of the moon’s north pole—a mosaic comprised of thousands of separate images—came in at 3.3 terabytes (for a tiny slice of the moon). How big is this? If you printed the map out, it would cover a football field and then some. The map of the northern lunar pole was generated with the help of a program called the Integrated Software for Imagers and Spectrometers. It was tricky work, and planetary scientists had to deal with converging longitudes and lighting issues endemic to mapping poles. Consistency of lighting, especially, proved a challenge, but is essential for accuracy.
When you want precise work, you need a human brain.
Computers are great at stitching together maps from image sources, but the resulting product is not always usable. The reason is that computers don’t see images; they see only pixel values. Mapping issues that might stump the most powerful computer can sometimes be solved in seconds by the human brain, which has an uncanny ability to recognize when something is not quite right. The work of mapping a planet, asteroid, or moon is tedious work and requires meticulous, pixel-perfect effort on the part of scientists to get things usable for the wider field of planetary science.
Scanning celestial bodies isn’t like Star Trek.
The geological mapping of other worlds sometimes uses astronomical spectroscopy to measure electromagnetic radiation. Instruments on satellites and orbiters gather data from celestial bodies to map such things as minerals in rocks and soil. To actually interpret that data, however, scientists need laboratory measurements against which to compare. One problem: the laboratory measurements taken on Earth have a bias for this planet. To increase accuracy, geologists have to adjust conditions, and can use chambers able to manipulate pressures, temperature, and atmosphere to make things more like the body in question. They then create a database of their measurements to match with the data collected by instruments on such satellites as the Lunar Reconnaissance Orbiter.
Creating laboratory spectra is slow, meticulous work, and there’s a lot to it. It requires the characterization of thousands of different minerals calibrated to the data from orbiters. Furthermore, the viewing geometry of instruments—where the instrument is versus where the sun is versus where the surface of the moon is—can create differences, and planetary scientists must account for all such variables.
Planetary bodies change—a lot.
Planetary scientists use the measure of crater density—the number of craters of a given size range in a given area—to date in relative terms the age of the lunar surface. Older surfaces will have more craters than younger surfaces. In working out the relative age of the moon’s surface, however, not all craters are created equal. There are “primaries” and “secondaries.” Primaries are when bodies crash into the moon, as you’d expect. Secondaries are the result of the debris from the craters created by the primaries. (Think stones skipping on water.) Obvious secondaries have characteristic shapes and often overlap or result in a herringbone pattern, and must be removed from the crater count.
There are landslides on the moon.
Mapping the moon is made even more challenging because the face of the moon is always changing, which is why the Lunar Reconnaissance Orbiter has proven vital. Each LRO dataset essentially reveals a brand new moon. In the time between the start of the LRO mission and today, there have been over 10,000 surface changes recorded by planetary scientists. LRO data on surface changes allow scientists to constrain the impact flux on the moon, which is to say that ages derived from crater counts are becoming increasingly accurate as scientists learn the flux of impacting objects and the creation of craters in our current timescale. Because of LRO data, we now know that the surface of the moon is dynamic.
