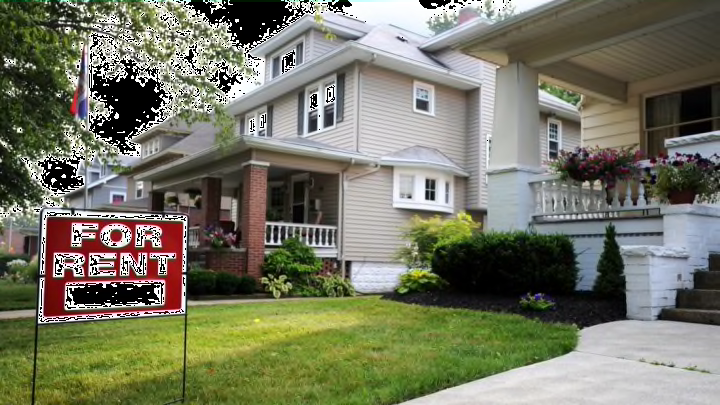
In many places across the U.S., the rent is simply too damn high. Average housing prices are rising twice as fast as wages are, and as a result, more and more people are renting. And that's not cheap either—as of 2015, 38 percent of American households were "rent-burdened," meaning spending more than 30 percent of their income on housing.
What does this mean for you? This map from the cost information site How Much, spotted by Thrillist, can tell you. It details what kind of monthly income you need to make in order to rent the average home in each state without spending more than 30 percent of your salary.
The map may confirm what you already suspected: Places like California, New York, Massachusetts, D.C., and Hawaii are very expensive to live in. You might be surprised to learn just how expensive, though. While a renter in Iowa only needs to earn $3500 or so a month to comfortably pay for housing, someone living in Washington, D.C. needs to make almost $8500 a month, or almost $102,000 a year.

Here's what you need to make each month to live in the top 10 most expensive states in the U.S.:
1. Washington D.C.: $8487
2. California: $8313
3. Hawaii: $7806
4. New York: $7223
5. Massachusetts: $7193
6. New Jersey: $6717
7. Colorado: $6197
8. Washington: $5993
9. Maryland: $5863
10. Connecticut: $5590
And here are the 10 cheapest:
1. West Virginia: $2960
2. Oklahoma: $3117
3. Arkansas: $3157
4. Alabama: $3313
5. Missouri: $3367
6 Kansas: $3437
7. Iowa: $3473
8. Mississippi: $3493
9. Kentucky: $3570
10. Ohio: $3613
But before you pack up and move to West Virginia or Mississippi, be aware that those states also have some of the lowest median wages in the U.S., meaning that in reality, housing isn't all that affordable there, either.
There are, to be sure, some weaknesses with this particular data. The map doesn't take into account what kind of home you'd be renting—it just looks at the median price for a rental in each state—nor does it distinguish between locations within states. (The rent in Syracuse, New York is a lot different than the rent in Manhattan, just like the rent in San Francisco is a lot different than the rent in Fresno, California.) But it's still a useful snapshot of our current housing situation.
Take a look at the rest of the data over on HowMuch.net.
[h/t Thrillist]
