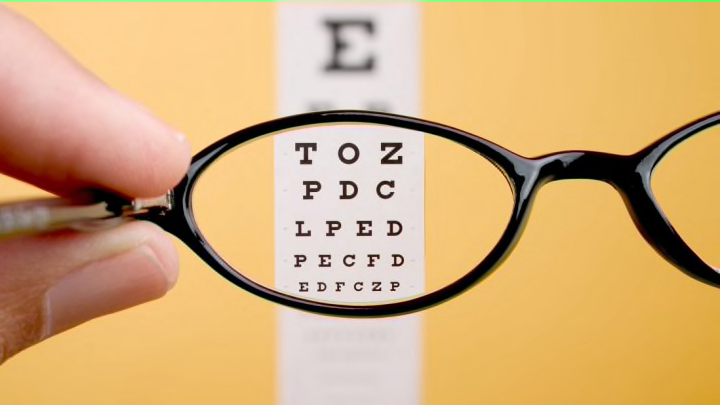
Next time you're forced to take a vision exam at the DMV, take a moment to appreciate the complex math that went into the eye chart. What seems like a fairly straightforward way to assess eyesight is actually the result of specific calculations that can tell you a lot about how the human eye works.
As The Verge explains in the video below, eye charts measure one aspect of healthy vision: visual acuity. This is our ability to make out fine details in our surroundings—kind of like the resolution of a computer screen, but instead of pixels, it's measured in degrees. It's easy for our eyes to tell the difference between two points of light coming from different directions, but if those points start to move closer together they will eventually blur into one. The angle created just as two lines of light become too close for our eyes to distinguish them is called the resolution limit. In healthy adults, it measures one-sixtieth of a degree, or one arcminute wide.
When a doctor asks you to read an eye chart, the resolution limit is what they're looking for. The letters in the middle of an eye chart are all designed to be exactly one arcminute thick. If your vision is sharp, you should be able tell the difference between the white spaces and the black lines of the text from 20 feet away.
A perfect 20/20 score on an eye chart test doesn't mean you have perfect vision: Visual acuity, along with color, contrast, and depth perception, are all important parts of healthy eyesight. And a higher resolution limit isn't always a sign of a permanent problem: For people who spend their days staring at a screen, it may be caused by the eye fatigue brought on by Computer Vision Syndrome. If this is a problem for you, here are some ways to tweak your behavior.
[h/t The Verge]
