7 Early 20th Century Infographics Created by W.E.B. Du Bois

A new book collects the incredible visualizations he created for the 1900 Exposition Universelle in Paris.
W.E.B. Du Bois wasn’t just one of the foremost civil rights activists of the late 19th and early 20th centuries. He was also a data visualization whiz who was able to turn his sociological research into innovative infographics that communicated the reality of the African-American experience to the world. Du Bois spent more than 20 years of his life working as a sociologist at Atlanta University studying black communities. In 1900, he was asked to contribute to the American Negro Exhibit, a showcase at the Exposition Universelle in Paris designed to explore the progress of black Americans since Emancipation. In response, he and his students at Atlanta University created 60 different infographics on topics like literacy rates, property ownership, and population growth of black Americans using research from his sociology lab, U.S. government data from the Census, other reports. More than a century later, these innovative infographics have been collected in a new book from Princeton Architectural Press called W.E.B. Du Bois’s Data Portraits: Visualizing Black America. Here are seven fascinating Du Bois visualizations included in the book.
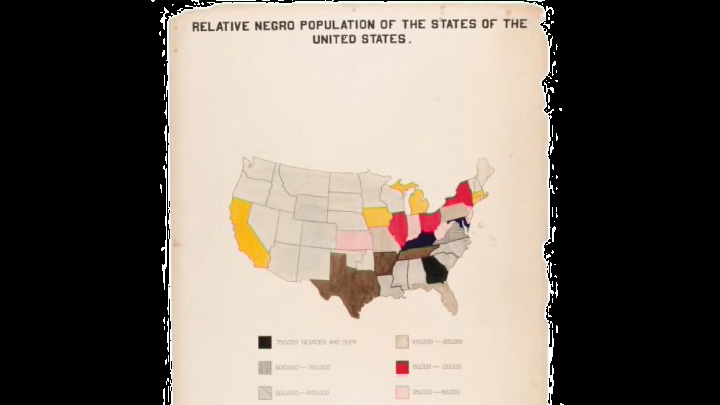
1. "RELATIVE NEGRO POPULATION OF THE STATES OF THE UNITED STATES"
The American Negro Exhibit, which these were designed for, was meant to demonstrate the progress of African-Americans in the South since the end of slavery.
2. "ASSESSED VALUE OF HOUSEHOLD AND KITCHEN FURNITURE OWNED BY GEORGIA NEGROES"
"The essence of the exhibit's narrative declared that African Americans had made amazing progress over just 35 years since Emancipation on most dimensions crucial to human well-being," sociologist Aldon Morris writes in the book. "This progress was remarkable given that black Americans had endured over two centuries of slavery, two decades of Jim Crow, and all the oppressive conditions associated with subjugation."
3. "ASSESSED VALUATION OF ALL TAXABLE PROPERTY OWNED BY GEORGIA NEGROES"
The aim, essentially, was to refute racist ideas of black inferiority. While social Darwinists of the time argued that inequality was a natural byproduct of inherent racial differences, Du Bois and his students at Atlanta University gathered data that showed that, despite incredible obstacles, America's black population had made remarkable progress since slavery ended, equal or greater to that of other populations facing similar barriers.
4. "ILLITERACY"
That included showing increases in literacy rates (black illiteracy rates in American were similar to European countries like Hungary, Du Bois noted), school enrollments, population (a refutation of the social Darwinist theory that the black population would eventually die out as part of "survival of the fittest"), land ownership rates, and other indications of social progress. Du Bois also compared statistics like marriage rates and age distributions of black American populations to that of black populations in European nations like France and Germany.
5. "CONDITION OF 300 NEGRO FARM TENANTS AFTER 1 YEAR'S TOIL, 1898"
Though they were designed to show racial progress, the visualizations did not provide a rosy view of African-American life in the South. Some portrayed the stark realities of how ongoing exploitation and oppression were still effecting black people. This one lays out the financial hardships tenant farmers dealt with at the turn of the century.
6. "COMPARATIVE RATE OF INCREASE OF THE WHITE AND NEGRO ELEMENTS OF THE POPULATION OF THE UNITED STATES"
Du Bois put the statistics in the context of greater international and domestic events. In this graph of comparative population increases between white and black populations in the U.S., he noted major factors that impacted these numbers, including "suppression of slave trade," the influx of European immigration, and Emancipation. (Du Bois's first book, published in 1896 and based on his Harvard dissertation, was called The Suppression of the African Slave Trade to the United States of America 1638-1870.)
7. "PROPORTION OF WHITES AND NEGROES IN THE DIFFERENT CLASSES OF THE OCCUPATION IN THE UNITED STATES"
At the time, creative and eye-catching data visualization was rare, especially in sociology. The charts, graphs, and maps Du Bois and his students created "foreshadowed new possibilities of communication sociological knowledge to the wider public," Morris writes. "From the vantage point of the 21st century, the innovator sociology contained in the exhibit continues to stand the test of time."
W.E.B. Du Bois’s Data Portraits: Visualizing Black America is available for $19 from Amazon.