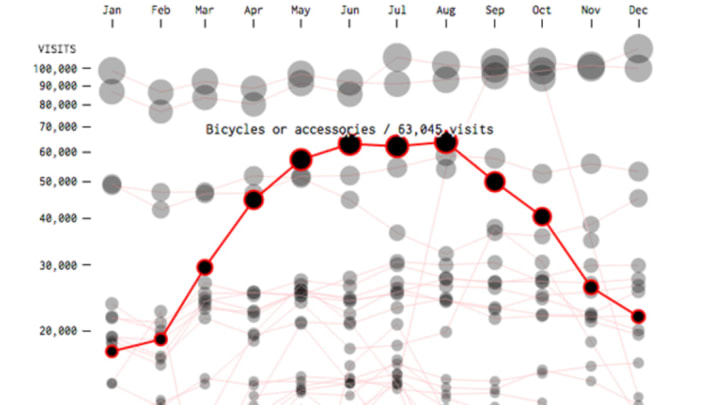
Ever wonder what the most dangerous household products are? Or what kinds of injuries are most common each season? In order to find the links between different consumer products, seasons, and injuries, Flowing Data has created an interactive graphic of the 250 objects most frequently associated with emergency room visits throughout the year using data from the Consumer Product Safety Commission's National Electronic Injury Surveillance System (NEISS). The chart gives a sense of what the most perilous consumer products are, as well as the time of year they’re most frequently used.
For example, the chart reveals that some objects, like beds, tables, and chairs, are associated with injury throughout the year. Since indoor furniture isn’t linked to any particular season, it’s unsurprising that those kinds of injuries are relatively consistent: You can trip over your coffee table or stub your toe on your bed frame no matter what the weather is like outside. Other objects, meanwhile, are associated with specific seasons, or even individual months. Sledding, swimming pools, and lawn mowers are all responsible for seasonal injuries, while fireworks-related injuries peak in July.
Though the chart illustrates potentially dangerous consumer products to look out for, it’s less a guide for living than a fascinating visualization of how Americans spend their time. It’s the story of our daily lives, told through our occasional clumsiness and inevitable mishaps. Check it out here.
[h/t Flowing Data]
