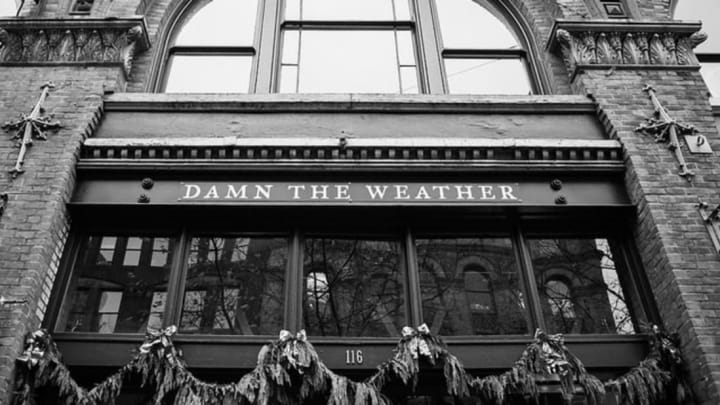
Seattle, Washington, has a reputation for the kind of weather that would depress a duck. The photo above was taken on December 7, 2015, and though it depicts a bar in Pioneer Square, it could've just as well been describing Seattleites' feelings about the weather that day. That's because thanks to the recent onslaught of flooding rains, Monday, December 7, 2015, will go down as the darkest day in Seattle in almost nine years.
According to meteorologist Scott Sistek at KOMO News, it was the darkest day recorded at the University of Washington in Seattle since December 14, 2006, and the second-darkest day recorded in the city in the 21st century.
According to American city stereotypes, we shouldn't be altogether surprised; Seattle is seen as reliably gloomy and rainy. That characterization isn’t always true, of course. But the city has been extraordinarily wet lately. And as good as we humans are at being able to judge how terribly gray and rainy it is, we can use some hard science to objectively determine gloominess.
We use data collected by weather stations every day, whether it’s checking the temperature on our phone or listening to the weather forecast, which is partially compiled using current observations. There are thousands of these stations around the world, measuring temperature, dew point (moisture), wind data, and a handful of other variables that tell us everything from soil moisture to air pressure. One of the lesser-known sensors attached to many advanced weather stations is called a pyranometer.
A pyranometer is a sensor that measures the amount of solar radiation reaching the surface; higher levels of solar radiation mean that the surface is receiving bright, intense sunshine, while lower levels indicate sunlight that’s blocked by clouds, trees, buildings, solar eclipses, alien spacecraft (okay, maybe not those), or anything else that could potentially cast a shadow.
On a day with clear skies, bright sunshine, and no obstructions around the device, the measurements recorded by a pyranometer plotted on a chart will create a perfect bell curve, with levels of solar radiation quickly rising around sunrise, peaking with the sun’s highest point in the sky on that particular day, then quickly waning until it drops to zero after sunset. The chart above shows a near-perfect solar radiation graph on the campus of the University of South Alabama in Mobile, Alabama, on August 26, 2015. The steep drop-off around 17:30 is the result of the sun dipping behind nearby trees an hour or two before sunset.
More often than not, though, these graphs are jagged, with sharp drops and spikes in radiation occurring as clouds and other objects block out the sun, or their reflections magnify the sunlight. On a rainy day with thick cloud cover, very little solar radiation reaches the ground, so the levels recorded are a small fraction of what you would see on a sunny day.
The below graph shows solar radiation recorded at the University of Washington between midnight December 4 and midnight on December 8. The tinier the spike on the graph, the drearier the day. According to weather legend Cliff Mass at the University of Washington, on December 6, Seattle had 2.56 MJ/m2 (megajoules per meter squared—a unit used to measure solar radiation). Now take a look at that tiny little bump on December 7. It represents a mere 0.44 MJ/m2. No wonder the day was so gloomy.
The combination of thick clouds, steady rain, Seattle’s high latitude, and the sun’s low angle (we’re just two weeks from the winter solstice) created these conditions. The heavy rain in Seattle will continue for several more days—and it’s a welcome sight, since most of Washington and Oregon are still mired in a drought. But the lack of sunshine is undoubtedly depressing to some area residents.
