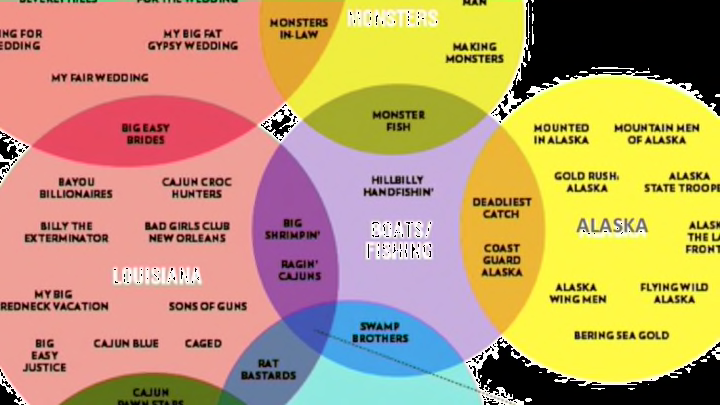
I haven’t done a roundup of Venn diagrams in several years. That’s a graph that shows sets and all possible overlaps of those sets. It works two-dimensionally when there are three or fewer sets. When you have more sets, or sets in which they don’t all overlap with each other, then you have an Euler diagram, which is a whole new set of fun. Not only are these diagrams a good visualization for a concept, they are also an opportunity for graphic humor.
1. Venn Diagram of Emotions

A common way to make Venn humor is to label three sets as concepts, and their overlaps as specific situations. The Venn Diagram of Emotions from Doghouse Diaries uses situations we are all familiar with.
2. Two Kinds

A variation on the humor Venn diagram concerns sets that cannot possibly overlap. Phil Plait illustrated this with an old math joke adjusted to the graphics world. He calls it Venn-Venn, which is a true venn-venn situation.
3. Euphemisms

However, it’s not always necessary to label all the overlaps, when you only need one punch line. Jessica Hagy always has all kinds of graphics humor at her webcomic Indexed; the one called Euphemisms tells you just what you need to know.
4. States of Matter

It is not necessary that the two or three sets of a Venn diagram actually have anything to do with each other, as long as you can come up with some justification for an overlap. Chemical symbols and state abbreviations? Why not? Redditor Smashinator came up with this idea while showering behind a shower curtain printed with the Periodic Table of the Elements.
5. TV Viewing

Here’s an Euler diagram in which all the sets cannot overlap, as some of them are opposites, yet they can overlap in a daisy-chain fashion, and the result makes perfect sense to anyone who has watched the devolution of American TV. This diagram sparked a bit of controversy when it was submitted to reddit, as there are plenty of both smart and dumb people who either watch all these shows or none of them. Or the ones they aren't supposed to watch.
6. Reality TV Venn

Set diagrams about TV can get much more complicated. If you ever flip through the cable TV channels, you've probably noticed how many reality series cluster around an existing idea. Yes, there's a lot of shows set in Louisiana. And quite a few set in Alaska, too. I once quipped that a network sees no use in wasting a field office on just one show, or two, or three. But what you see here is just a small portion of the Reality TV Venn Diagram by Margaret Lyons and Jen Cotton at Vulture. To see the full-size version, you’ll have to go elsewhere. And yes, I am aware that this is actually an Euler diagram, which shows existing sets and relationships, and not a true Venn diagram that would show all possible relationships. In the couple of years since this diagram was made, the shows have changed somewhat, but you can still fill those circles with appropriate series.
7. The Hobbit

Any pop culture phenomenon lends itself to extreme critique that can be diagrammed. Lesley Tsina created a simple Venn diagram that explained why so many more people watched The Hobbit movies than read the book.
8. Diagram Venn of Yoda It Is

Artist Stephen Wildish has built his reputation on clever and pun-filled graphs, visualizations, and minimalist representations of pop culture. In his Diagram Venn of Yoda, we see how previous tropes came together to create the beloved Star Wars character Yoda.
9. The Von Van Venn

Stephen Wildish created this Venn diagram as part of his Friday project. The Von Van Venn diagram uses large and seemingly unrelated sets to indicate the puns in the overlaps. It could be made more complicated with the addition of Vin Diesel, the subject of an earlier diagram.
10. Doctor Who

Comic artist Aaron Williams created this Venn diagram proving that Doctor Who is in the middle of the science fiction universe. It was once sold as a t-shirt, but no longer available. More’s the pity.
11. The Venn Piagram

And now we are leaving the world of virtual two-dimensional diagrams and looking at how they act in the real world. It turns out that Venn diagrams are delicious! Redditor HungryHungryHippy conceived the idea of the Venn Piagram for Pi Day (March 14), and posted the picture shortly afterward. The intersection of strawberry and blueberry could be called “berry” or it could be called “the piece I want.” She had to make her own pie tin, lined with parchment, to hold it.
12. Heaven and Hell Cake

A Heaven and Hell cake is when a baker uses both angel food cake and devil’s food cake. In this instance, Vivi Rrr combined the two into a Venn diagram, so the overlapping part is called “purgatory.” It is also called “tasty and decadent.” She posted the process of making it at Back to the Lab Again with plenty of pictures.
See more of this kind of nonsense in our previous posts: Fun with Venn and Euler Diagrams, 9 Silly Venn Diagrams, and Not-quite-Venn Diagrams.
